
The short answer
A KPI dashboard for a small business does not need to be complicated. It needs to show the five to ten numbers that tell you whether the business is healthy right now - revenue, margin, cash position, outstanding invoices, and whatever operational metric matters most in your sector. Built in Power BI or Excel, connected to your existing systems, it can be ready in days.
I have built dashboards for businesses across a wide range of sectors - construction, recruitment, professional services, retail, healthcare - and the starting question is always the same. What do you actually need to know to run this business well? Not what data do you have. Not what your accounting software can export. What do you need to know, right now, to make good decisions?
The answer to that question is your KPI dashboard. Everything else is a report.
What is a KPI dashboard and why does your business need one?
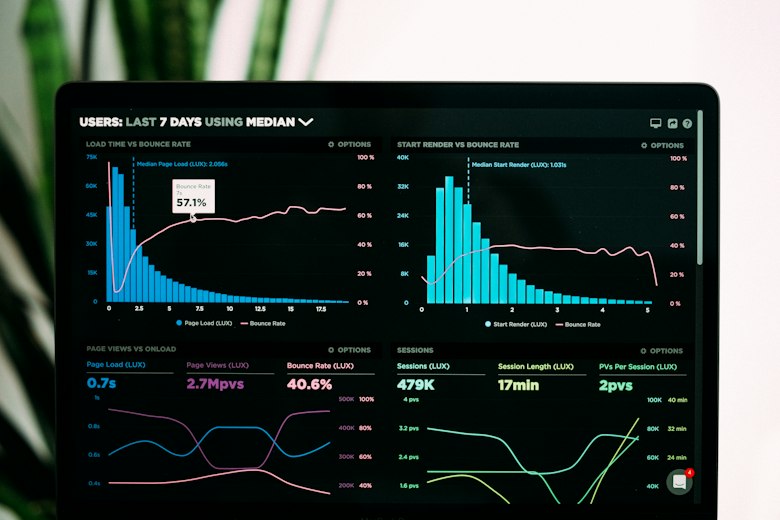
A KPI dashboard is a single screen that shows your most important business metrics, updated automatically from your actual data. KPI stands for Key Performance Indicator - the specific numbers that tell you whether your business is moving in the right direction.
The difference between a KPI dashboard and a report is that a dashboard is live. It updates automatically when new data arrives - from your accounting software, your CRM, your operations systems - without anyone exporting, formatting, or compiling anything. You open it, you see the current picture, you act on it.
Most small businesses do not have this. They have reports - produced weekly or monthly by someone who spends hours pulling the data together. By the time the report lands, it is already out of date. A dashboard fixes that problem permanently.
Step 1: Decide what to measure
This is the most important step and the one most businesses get wrong. They try to put everything on the dashboard, end up with 40 metrics, and nobody knows what to look at. A good KPI dashboard for a small business has between five and ten metrics - no more.
Here is a framework for choosing. Ask yourself: if I could only look at one number to know whether this business is healthy right now, what would it be? Then ask the same question again. And again. Stop when you have five to ten numbers that together give a complete picture of financial health, operational performance, and leading indicators of future performance.
Common KPIs by business type
Step 2: Identify where your data lives
Once you know what you want to measure, the next question is where that data actually lives. For most small businesses, the answer involves at least two or three systems - and that is where the challenge begins.
The goal of a KPI dashboard is to bring data from all of these sources into one place automatically. The more of your data that flows in without manual intervention, the more valuable the dashboard becomes.
Step 3: Choose the right tool
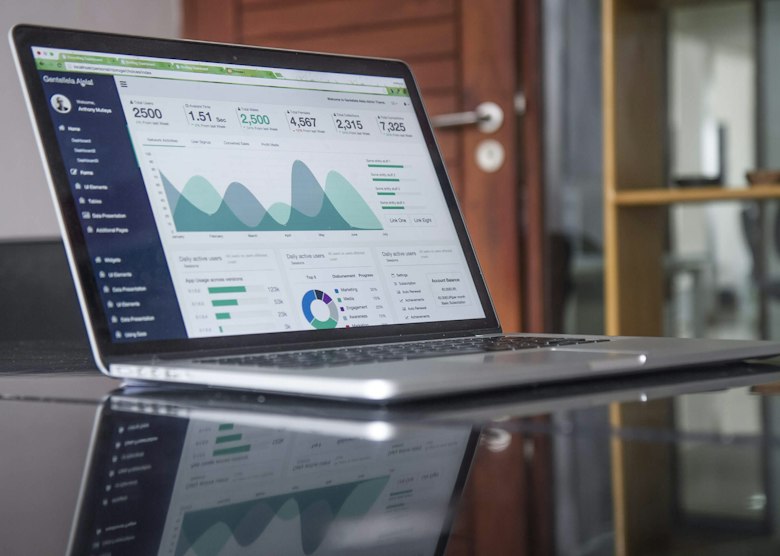
The tool you use for your KPI dashboard depends on who needs to see it, how your data is structured, and how technical your team is. Here are the main options for UK small businesses:
Step 4: Build it - or have someone build it for you
If you are technically confident and have the time, Power BI and Excel with Power Query can both be learned to a functional level. Microsoft has extensive free training resources, and for straightforward single-source dashboards the learning curve is manageable.
The point at which most business owners find it worth bringing in help is when the data comes from more than one source, when the data needs significant transformation before it makes sense in a dashboard, or when they have tried to build it themselves and hit a wall.
A properly built KPI dashboard - connected to your real data, designed around the decisions you actually need to make, with documentation so your team can use it independently - typically costs less than one month of the time currently being spent on manual reporting. And unlike the manual reporting, it keeps running indefinitely without anyone rebuilding it.

The most common mistakes small businesses make with KPI dashboards
Related: If your source data has quality issues - inconsistent formats, duplicates, blanks - fix those before building a dashboard. A KPI dashboard built on bad data produces wrong numbers with high confidence. Read our guide to data cleansing for UK businesses before you start.
Frequently asked questions
How much does it cost to build a KPI dashboard for a small business?
A properly built KPI dashboard for a UK small business - connected to your actual data, designed around your specific metrics, with documentation - typically costs between £500 and £2,000 depending on the number of data sources and the complexity of the metrics. We scope every project and give a fixed price before any work begins.
Can I build a KPI dashboard myself without technical knowledge?
For simple single-source dashboards, yes - Microsoft Power BI desktop is free and has extensive training resources. The difficulty increases significantly when you need to connect multiple data sources, handle data that needs cleaning or transformation, or build custom calculations. Most business owners find it more cost-effective to have a consultant build it correctly the first time.
How long does it take to build a KPI dashboard?
A straightforward KPI dashboard connected to one data source is typically delivered in 3-5 working days. A more complex multi-source dashboard with custom metrics and automated refresh takes 5-10 days. You get a clear timeline and fixed price before any work starts.
What is the difference between a KPI dashboard and a report?
A report is produced periodically by someone pulling data together - it is a snapshot of a moment in time, produced after that moment has passed. A KPI dashboard is live - it updates automatically from your data sources and always shows the current picture. Reports look backwards. Dashboards show you where you are right now.
Do I need Power BI Pro to share a KPI dashboard with my team?
Yes - to share a Power BI dashboard with others via the Power BI service, everyone who views it needs a Power BI Pro licence at £8.40 per user per month. There is also Power BI Premium Per User at a higher price point with additional features. For small teams sharing with two or three people, the Pro licence cost is usually negligible compared to the time saved.
Could a custom business tool replace our dashboard?
A KPI dashboard and a custom business tool serve different purposes - a dashboard surfaces data for decisions, while a custom tool manages a process. Many businesses benefit from both: a custom tool to run the operation and a dashboard to track performance. We build both and can advise on which combination makes sense for your specific situation.
Further reading
Related articles
Power BI vs Excel: Which Should Your Business Use in 2026?
Power BIPower BI Consultant Cost UK: Hourly Rate & Day Rate Guide
Data Automation5 Signs Manual Reporting Is Costing Your Business Money
FinanceMy Finance Team Is Spending Hours on Manual Reporting
Want a KPI dashboard built for your business?
Most of our Power BI work starts with somebody rebuilding this by hand every month. Book a free 30-minute call. Tell us what decisions you need to make and what data you have. We will tell you exactly what a dashboard would look like and what it would cost to build it.
Book a free scoping call →